
Chrome DevTools MCP
Official open-source MCP server and CLI that lets coding agents control, inspect, and debug a live Chrome browser with real DevTools context.
Do not bounce yet
Read the fit check, compare one alternative, then decide whether the vendor page is still your best next click.
Quick Verdict
Fast fit check before you leave the page
Make the fit call first. Vendor pages are good at selling, but they rarely tell you where the product is a bad match.
- Developers using Claude Code, Codex, Cursor, Copilot, Gemini CLI, or similar agents on web products
- Frontend and full-stack teams debugging UI regressions, console errors, auth flows, or performance issues
- Builders comparing Chrome DevTools MCP vs Playwright MCP or other browser MCP approaches
- Chrome DevTools MCP is a capability layer, not a full repo-aware coding agent, so it still depends on the quality of the agent driving it.
- Official support is for Google Chrome and Chrome for Testing; other Chromium-based browsers may work, but you are outside the support line.
- Connecting to an existing browser session or opening remote debugging ports creates real privacy and security footguns if your setup discipline is sloppy.
Compare Next
Take one more internal step before the vendor pitch
This is where visitors usually jump out too early. Read one deeper take or open one alternative so the next click is informed instead of impulsive.
Alternative profile
Stagewise
Open-source frontend coding agent and purpose-built browser that lets developers click live UI, inspect runtime context, and apply changes to real local codebases.
Alternative profile
Symphony
Apache-2.0 Codex orchestration spec and Elixir preview that turns Linear issues into isolated, long-running agent implementation runs.
Alternative profile
Google Agents CLI
Google open-source CLI and skill bundle that teaches Claude Code, Codex, Antigravity, and other coding agents to build, evaluate, deploy, and publish ADK agents on Google Cloud.
Chrome DevTools MCP matters because most coding agents are still half-blind when the real problem lives in the browser. Reading files is not the same thing as seeing the running app, the console, the network waterfall, or the performance trace. Chrome DevTools MCP fixes that gap by giving agents a live Chrome session with real debugging tools instead of making them hallucinate from source code and screenshots.
Chrome DevTools MCP is one of the most obviously relevant omissions in an agent-coding directory because it gives coding agents something they usually lack: direct access to a real browser session with Chrome DevTools-grade debugging instead of screenshot theater. Agents can inspect the DOM, console, network requests, performance traces, screenshots, and user flows through an MCP server or CLI, then verify fixes against the live app instead of guessing from source alone. That makes it highly relevant to vibe coding teams shipping web products, especially when frontend bugs, auth flows, regressions, or performance issues punish file-only reasoning.
Why Choose Chrome DevTools MCP?
If you build or debug web products with coding agents, Chrome DevTools MCP gives them the browser context they were missing instead of asking them to reason from files alone.
It is more credible than generic browser-control wrappers because it comes from the Chrome DevTools team and exposes real debugging and performance primitives.
The project has crossed out of novelty territory: GitHub, npm, Hacker News, and ongoing ecosystem discussion all show it has become infrastructure, not a toy launch.
This is one of the rare additions that is both obviously relevant to vibe coding and strong enough to deserve directory inclusion without apology.
Key Features
Official Chrome DevTools MCP server plus CLI for letting coding agents control and inspect a live Chrome browser.
Real debugging surface for agents: console messages, network requests, DOM snapshots, screenshots, performance traces, memory snapshots, and Lighthouse audits.
Supports both launching an isolated Chrome profile and connecting back to a running Chrome instance for authenticated or shared-state workflows.
Works across major MCP-capable coding environments including Claude Code, Codex, Cursor, Copilot, Gemini CLI, Windsurf, and other compatible clients.
Configurable categories, slim mode, viewport settings, proxy support, remote browser connection options, and experimental screencast / vision capabilities.
Distributed as an active Google-backed open-source project via GitHub and npm with frequent releases and broad ecosystem documentation.
Pros & Cons
- This is the browser-debugging layer most coding agents actually needed: real DevTools context beats screenshot theater and DOM guessing.
- Official Chrome/DevTools ownership plus huge adoption makes it materially more credible than the endless parade of thin browser MCP clones.
- It covers practical developer workflows like localhost validation, auth flow debugging, network inspection, and performance tracing instead of just generic click automation.
- Open-source distribution and npm install path make it easy to test inside existing agent stacks without procurement nonsense.
- Chrome DevTools MCP is a capability layer, not a full repo-aware coding agent, so it still depends on the quality of the agent driving it.
- Official support is for Google Chrome and Chrome for Testing; other Chromium-based browsers may work, but you are outside the support line.
- Connecting to an existing browser session or opening remote debugging ports creates real privacy and security footguns if your setup discipline is sloppy.
- Google usage statistics are enabled by default unless you opt out, which privacy-sensitive teams may reasonably dislike.
Detailed Use Cases for Chrome DevTools MCP
Use Chrome DevTools MCP when you want a coding agent to open the running app, click through the real flow, and confirm the fix works instead of trusting a patch that merely compiles.
It is especially useful when the bug lives in the console, network layer, DOM state, or a flaky auth flow that a file-only agent cannot see.
Because the tool exposes performance traces and Lighthouse-style auditing, it can support agent workflows that optimize loading behavior instead of just changing code blindly.
Teams working on internal apps or protected customer journeys can connect agents to a running Chrome session and debug real authenticated behavior with human oversight.
Who Should Use Chrome DevTools MCP?
Developers using Claude Code, Codex, Cursor, Copilot, Gemini CLI, or similar agents on web products
Frontend and full-stack teams debugging UI regressions, console errors, auth flows, or performance issues
Builders comparing Chrome DevTools MCP vs Playwright MCP or other browser MCP approaches
Teams that want agents to validate changes against a real localhost or logged-in browser session
Perfect For
Let a coding agent verify that a localhost UI change actually works in the browser before you trust the patch.
Debug console errors, broken network requests, and flaky auth flows with an agent that can inspect the real session instead of guessing from code alone.
Run performance traces and Lighthouse-style audits from an agent workflow when a web app feels slow and you need evidence instead of vibes.
Connect an agent to a running logged-in Chrome session for supervised testing of protected internal tools or complex customer journeys.
Technical Details
Chrome DevTools MCP Comparisons & Alternatives
Chrome DevTools MCP review
Chrome DevTools MCP vs Playwright MCP
browser debugging MCP for coding agents
Chrome DevTools for Claude Code and Cursor
real browser verification for AI coding agents
Developers compare Chrome DevTools MCP with other vibe coding tools when they need a better workflow fit, not just a better landing page.
Direct Competitors
Playwright MCP
BrowserOS
OpenBrowser
Stagewise
Similar Tools You Might Like
Apache-2.0 Codex orchestration spec and Elixir preview that turns Linear issues into isolated, long-running agent implementation runs.
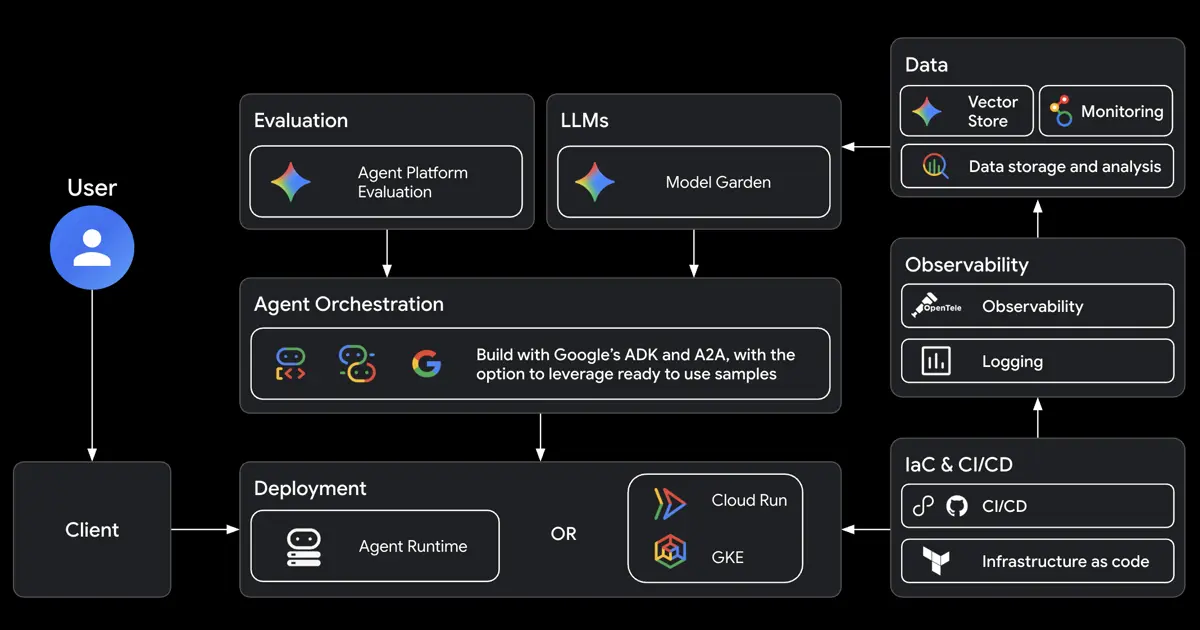
Google open-source CLI and skill bundle that teaches Claude Code, Codex, Antigravity, and other coding agents to build, evaluate, deploy, and publish ADK agents on Google Cloud.
Open-source CLI that gives AI coding agents visual verification through browser recordings, screenshots, logs, and PR-ready proof artifacts.
Alternative Tools to Consider

Open-source frontend coding agent and purpose-built browser that lets developers click live UI, inspect runtime context, and apply changes to real local codebases.
Do one more comparison before you commit to Chrome DevTools MCP
Strong picks usually survive one more internal check. Read deeper, compare a neighbor, then leave for the vendor page if the fit still holds.